Congratulations!
Your request was successfully sent!

Oops... Error!
Something went wrong, try again

A Gantt chart is a way of displaying processes in the form of a graph that allows you to plan the process of working on a project, build work schedules, and determine and control deadlines. The diagram looks like a waterfall graph, where segments (stripes) are displayed on a horizontal time scale.
Each segment is a separate process, its beginning and end correspond to the time period when the process is executed. Having seen such a schedule, the company will be able to compare the duration of projects, knowing the timing allows making operational decisions in case of a delay, about how many projects can be carried out simultaneously, what and when to plan, how to prioritize.
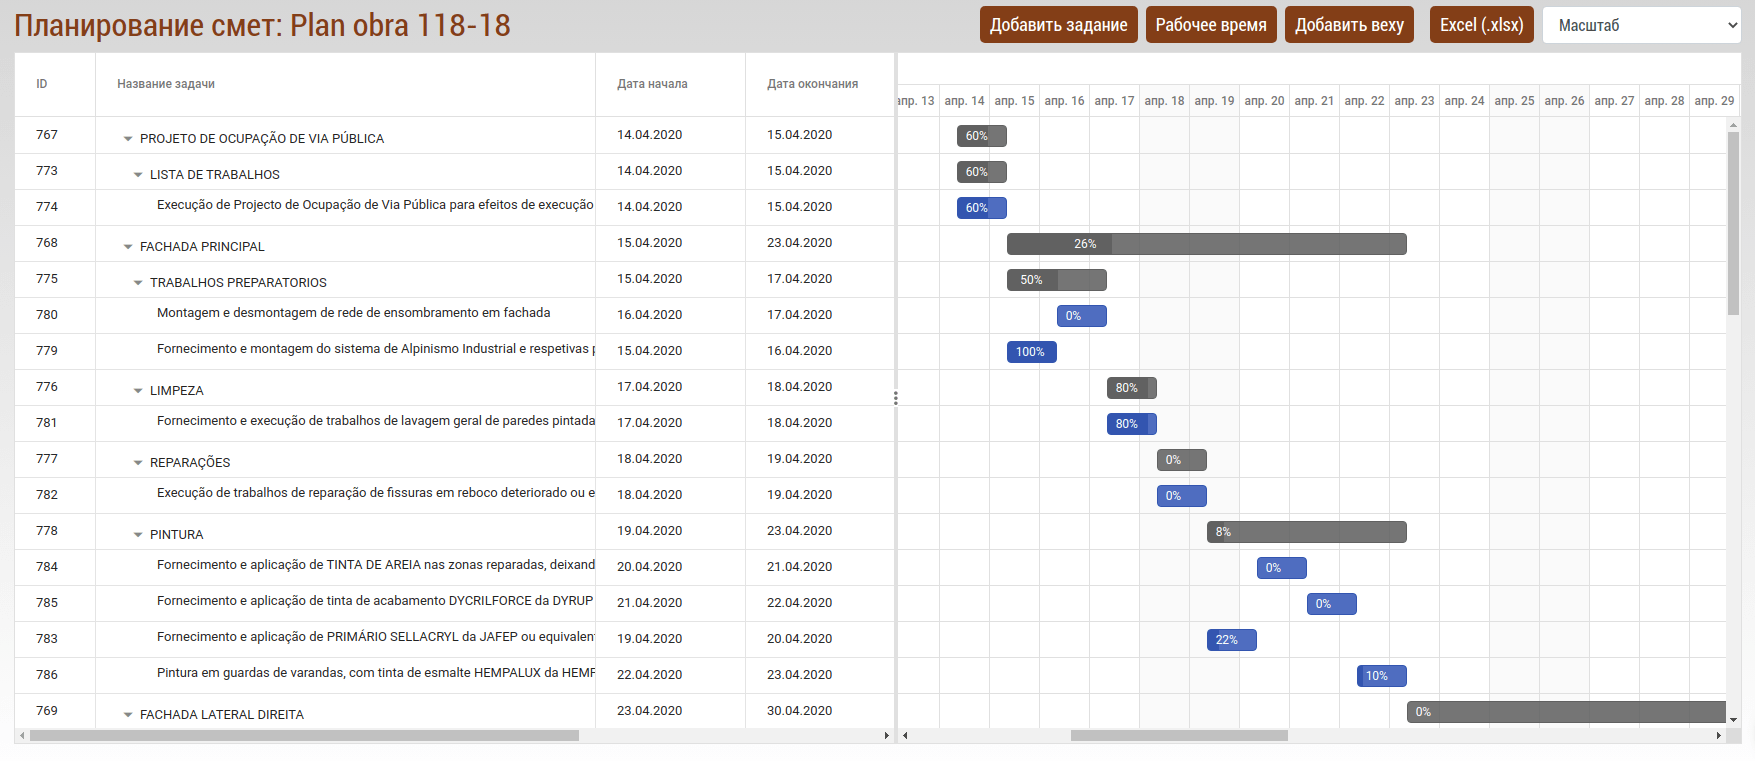
Diagrams are created for presentation to high-level management and clients to illustrate important events, goals and objectives of the project, in addition, you can create milestone diagrams for important presentations, as well as communication with senior management and clients, it is possible to export to Excel.
Combine processes of planning and scheduling in one workforce software for complete visibility and control over all workforce management processes - from long-term workload planning to daily task scheduling and real-time scheduling.
Get real-time insights to improve efficiency, improve first-time troubleshooting, improve customer service and retention, and increase employee satisfaction. Key features and benefits:
Personal - filled at your own discretion,
depending on the situation;
Estimate - the schedule is generated automatically
with estimate data.
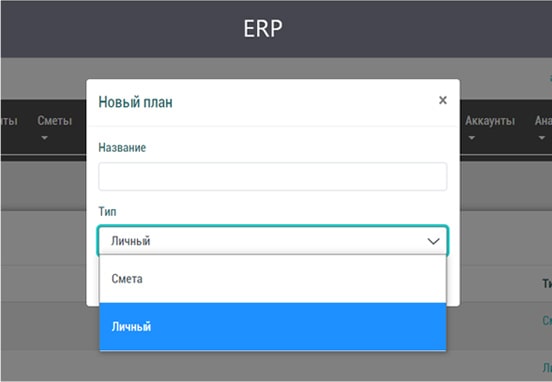
You can create a Gantt chart on the basis of planning by defining workers by directions. After that, the system will automatically assign the “estimate” type, when creating a diagram with the estimate type, it automatically loads the components of the estimate, types of work, materials, tools, etc.
Automatically builds a chart based on the entered data by working hours and hours. This functionality significantly reduces the time required to fill in data.
You can set parent and child tasks in your project, if the task is relatively large and requires several users with different skills to manage it, split the task into subtasks.
It is necessary to calculate how long it will take to complete a particular job, so you can accurately determine the number of personnel that need to be withdrawn, and draw up a shift schedule.
Consider the factors that affect the speed at which you complete different tasks. It is also necessary to take a responsible approach to performing routine maintenance - to schedule them for hours.

Find a tool that will provide you with information about the real time of employees' work in the most reliable and cost-effective way for you.