A common problem in customer and lead companies is tracking performance and the evolution of results in line with company goals.
We will explain what dashboards are, their features and benefits to help you improve your performance and your teams as a whole.
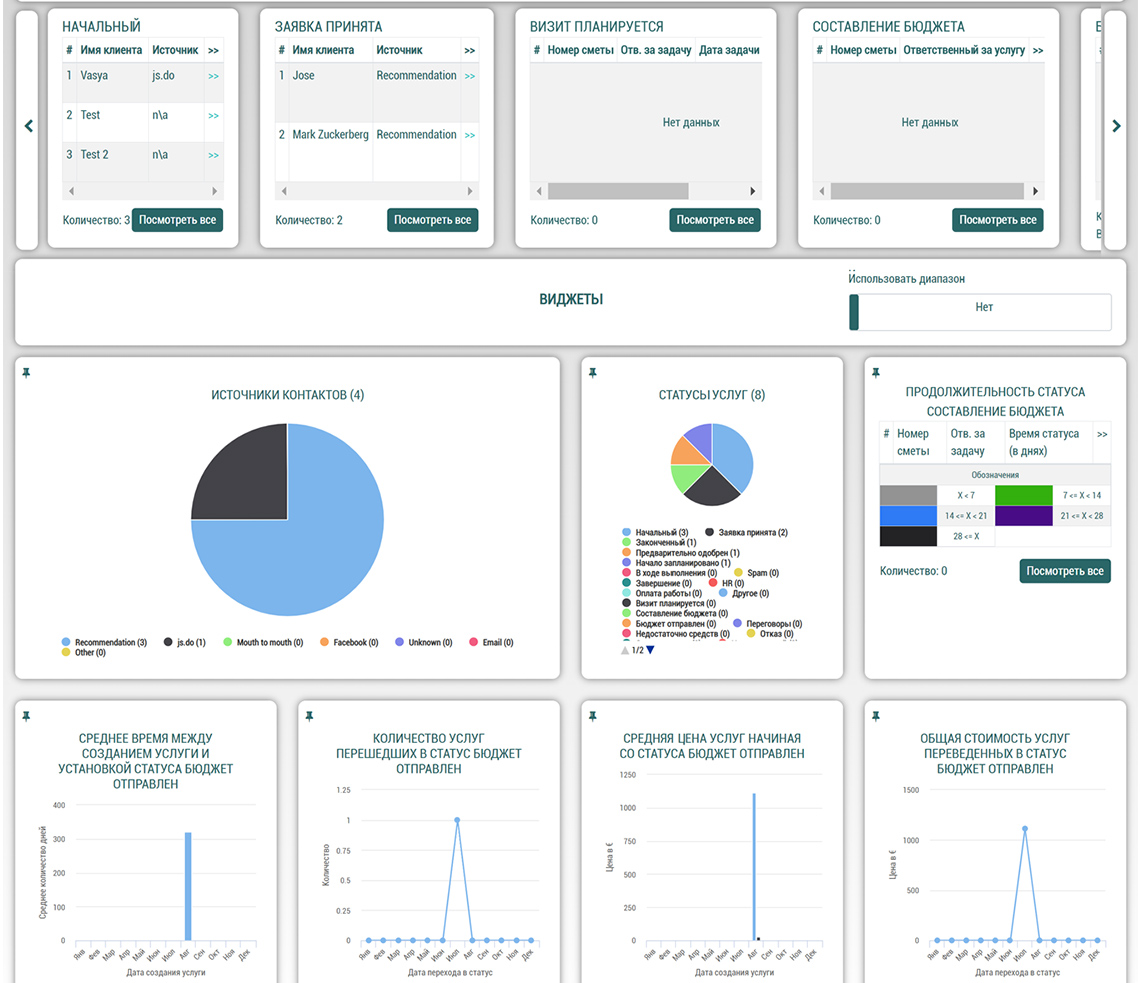
Dashboards - display metrics, stages of work with leads and customers, as well as important indicators for achieving goals and objectives, indicated visually, making it easier to understand the information received.
There are several types of information generation. But the visual format scores a lot when it comes to understanding how the results are going, allowing anyone to consume information - from trainees to highly specialized professionals.
The purpose of dashboards is to make it possible to monitor company performance across multiple metrics. To reach this level, you need to answer basic questions in order to get the desired answers. To correctly identify the issues, you must clearly understand the needs of the company. Determining KPIs for follow-up is extremely important for you by asking the necessary questions.
Once you've identified the tracking metrics you need, it's easier to move on to the next step in creating your dashboard. Visualization of the presented data and information will make it possible to control the situation in the company, optimize and improve performance.

In some cases, infographics are used to decipher numbers and data in a simple way that was previously difficult, but for the most part, graphics are used to represent information. Because they are universal, many people already understand their reading.
The key to the control panel is the ability to communicate information quickly and efficiently.
Powered by Froala Editor


